The Global Construction Newsletter
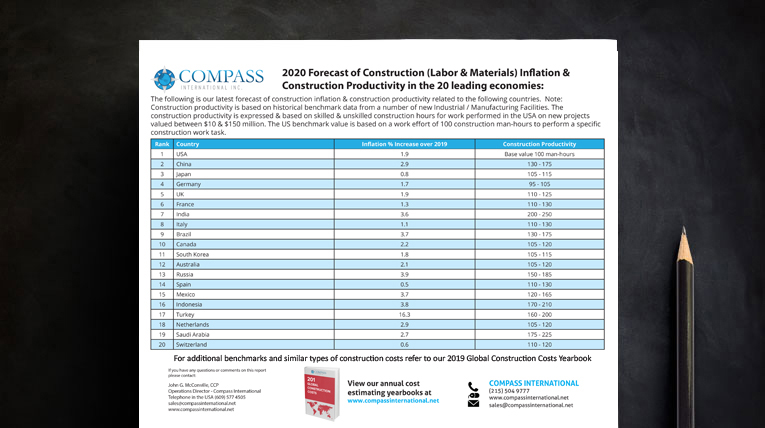
The following is our latest forecast of construction inflation & construction productivity related to the following countries. Note: Construction productivity is based on historical benchmark data from a number of new Industrial / Manufacturing Facilities. The construction productivity is expressed & based on skilled & unskilled construction hours for work performed in the USA on new projects valued between $10 & $150 million. The US benchmark value is based on a work effort of 100 construction man-hours to perform a specific construction work task.
| Rank | Country | Inflation % Increase over 2019 | Construction Productivity |
|---|---|---|---|
| 1 | USA | 1.9 | Base value 100 man-hours |
| 2 | China | 2.9 | 130 - 175 |
| 3 | Japan | 0.8 | 105 - 115 |
| 4 | Germany | 1.7 | 95 - 105 |
| 5 | UK | 1.9 | 110 - 125 |
| 6 | France | 1.3 | 110 - 130 |
| 7 | India | 3.6 | 200 - 250 |
| 8 | Italy | 1.1 | 110 - 130 |
| 9 | Brazil | 3.7 | 130 - 175 |
| 10 | Canada | 2.2 | 105 - 120 |
| 11 | South Korea | 1.8 | 105 - 115 |
| 12 | Australia | 2.1 | 105 - 120 |
| 13 | Russia | 3.9 | 150 - 185 |
| 14 | Spain | 0.5 | 110 - 130 |
| 15 | Mexico | 3.7 | 120 - 165 |
| 16 | Indonesia | 3.8 | 170 - 210 |
| 17 | Turkey | 16.3 | 160 - 200 |
| 18 | Netherlands | 2.9 | 105 - 120 |
| 19 | Saudi Arabia | 2.7 | 175 - 225 |
| 20 | Switzerland | 0.6 | 110 - 120 |